Overview
Column
National Overview
Side by Side
All Jazz Orgs
Column
Intoduction
Abstract
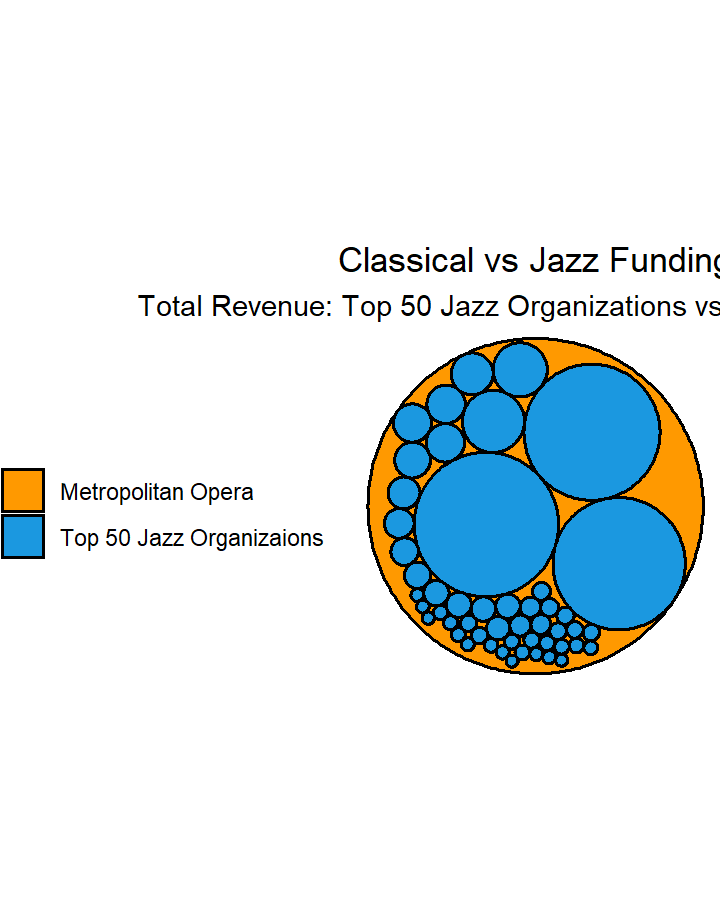
It has long been observed by Jazz musicians that when it comes to American art music funding, Classical Institutions take the lion’s share. These are of course anecdotal observations, however, this study seeks to verify these observations and, if possible, quantify them.
This study has two sets of goals:
Short-term goals:
Answer the questions:
- Is there a funding disparity between Jazz and Classical Institutions?
- If so, how can the disparity be quantified?
Long-term goals:
- Track disparities over time
- Gain insight into how reliant American art music is on grants/contributions
- Use as a platform to discuss a more sustainable future for Jazz
- Empower Jazz Institutions in their fundraising efforts
- Assist in the discussion about institutional racism in America
Methodology
This study compares the top 50 Jazz and Classical Non-profit Institutions, respectively, as determined by total revenue in the most recent tax documents available. A variety of metrics are looked at for comparison, in four main categories: Personnel, Revenue, Expenses, and Bottom Line. These metrics are investigated in terms of averages per organization type, totals by organization type, and totals by each organization.
The dataset, which can be explored on the last page of this dashboard, was collected from publicly available tax documents from ProPublica’s ’Nonprofit Explorer. The dashboard will be updated as more data is made available.
Of the data presented: 66% is from 2019, 31% is from 2018, and 3% is from 2017. Differences in when organizations report, when the IRS processes, and when ProPublica publishes accounts for the gaps in reporting. These are all pre-pandemic figures. This shortcoming in the data stream will be evened out over time by updating the dataset as new numbers are released.
This study does not include for-profit organizations, colleges/universities, or organizations that offer both Jazz and Classical programming. This is due to lack of publicly available data, the difficulty in parsing funding streams within an organization that supports both genres, and/or the limited resources of the author. However, it would be beneficial for future studies to look at the types of organizations just mentioned.
Credits/Contact
This study and dashboard was created by Jazz bassist and data nerd Nicholas Krolak.
Founder of Retrograde Analytics, a data research and analytics firm that perfroms data tasks and projects for nonprofit organizations and small businesses whose work benefits arts/culture, sustainability, and civics in order to harness the power of data for the greater good.
Retrograde Analytics specializes in:
- data collection
- network analysis
- geospatial data
- interactive dashboard creation
- customized research
- predictive algorithms
Questions and comments can be sent to retrogradeanalytics@gmail.com.
Totals by Organization
Column
Total Revenue
Grants and Contributions
Program Revenue
Investment Revenue
Other Revenue
Total Expenses
Grants Paid
Salaries/Compensation
Fundraising Expenses
Other Expenses
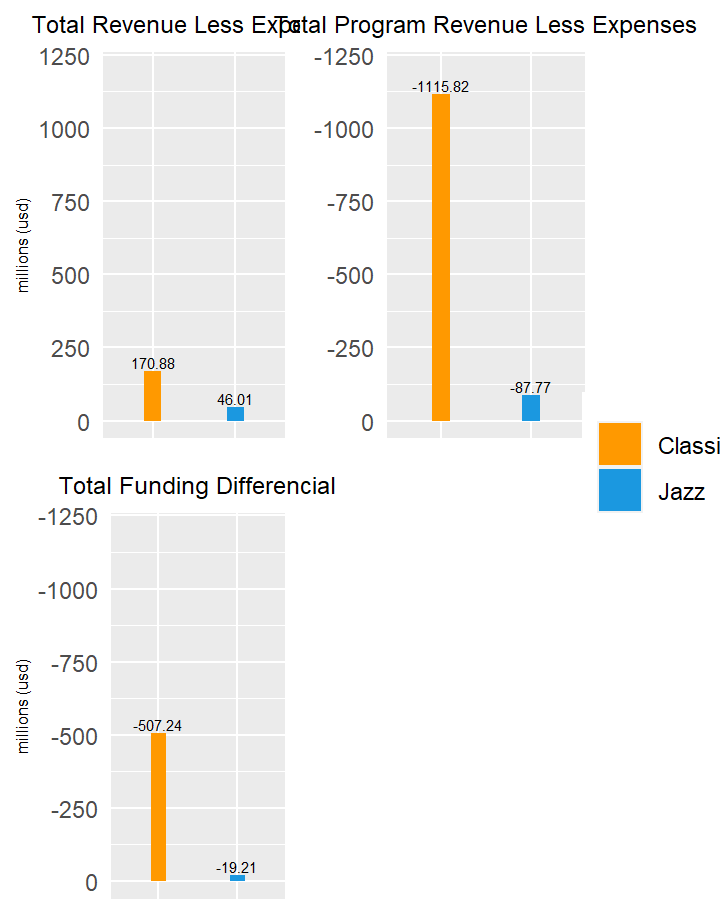
Revenue Less Expenses
Program Revenue Expenses
Funding Differential
Grant/Contribution Dollars Recieved per Fundraising Dollar
Percent Revenue from Grants
Percent Program Revenue
Total Number of Employees
Total Number of Volunteers
Averages by Type
Column
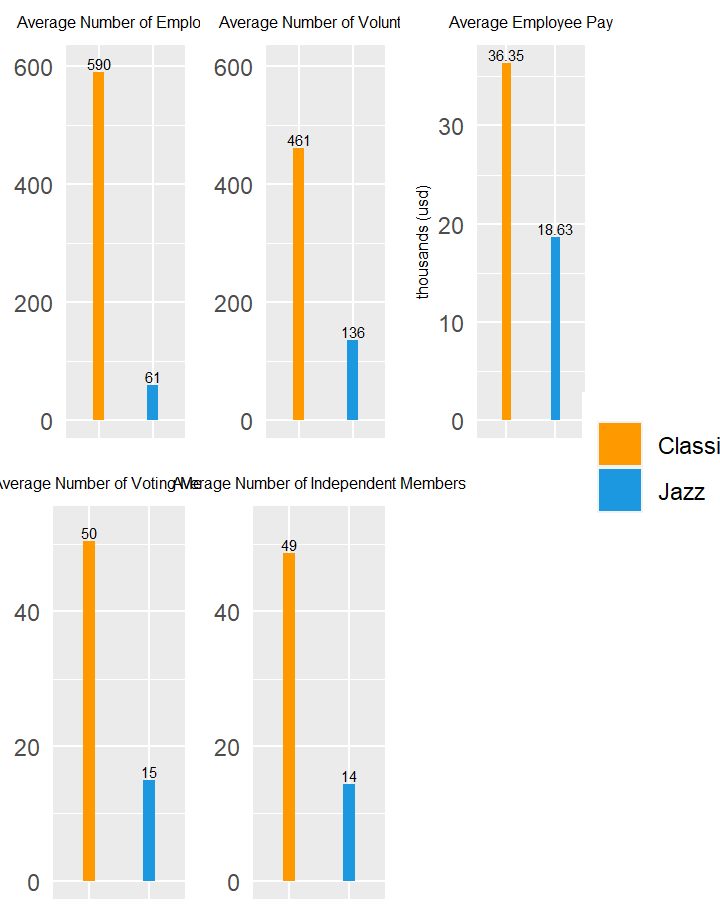
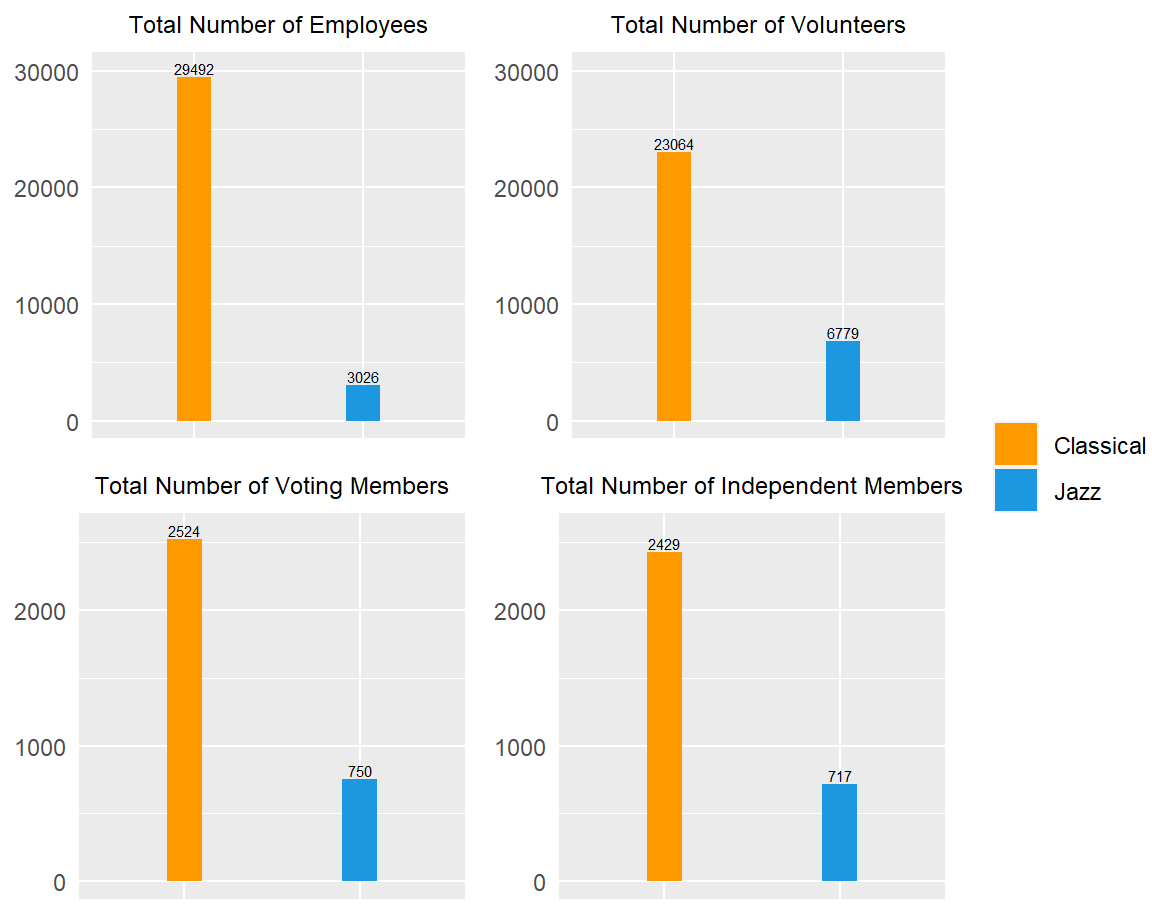
Personnel
Revenue
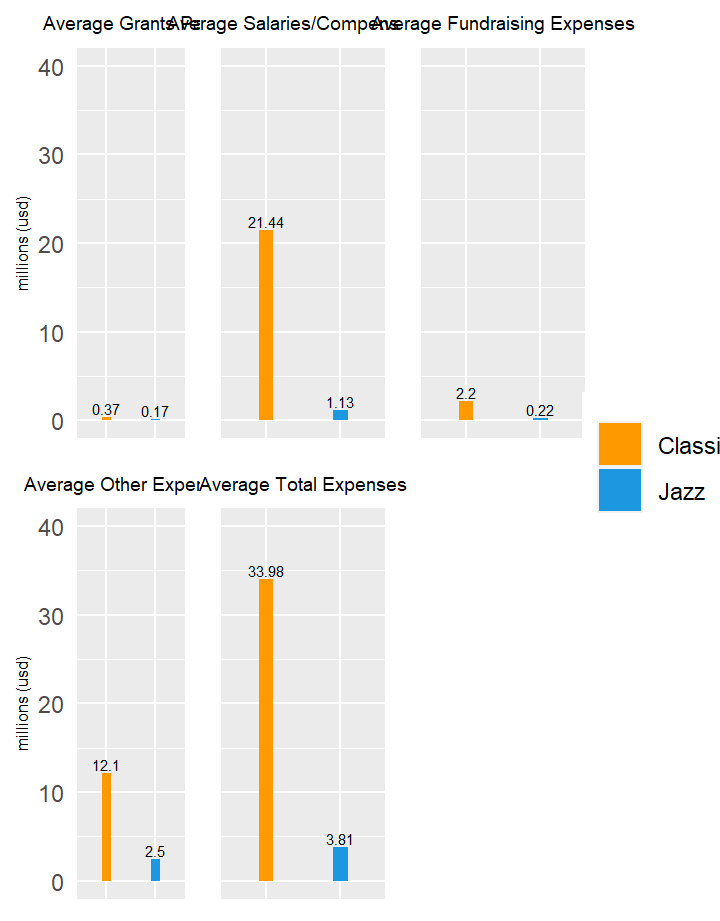
Expenses
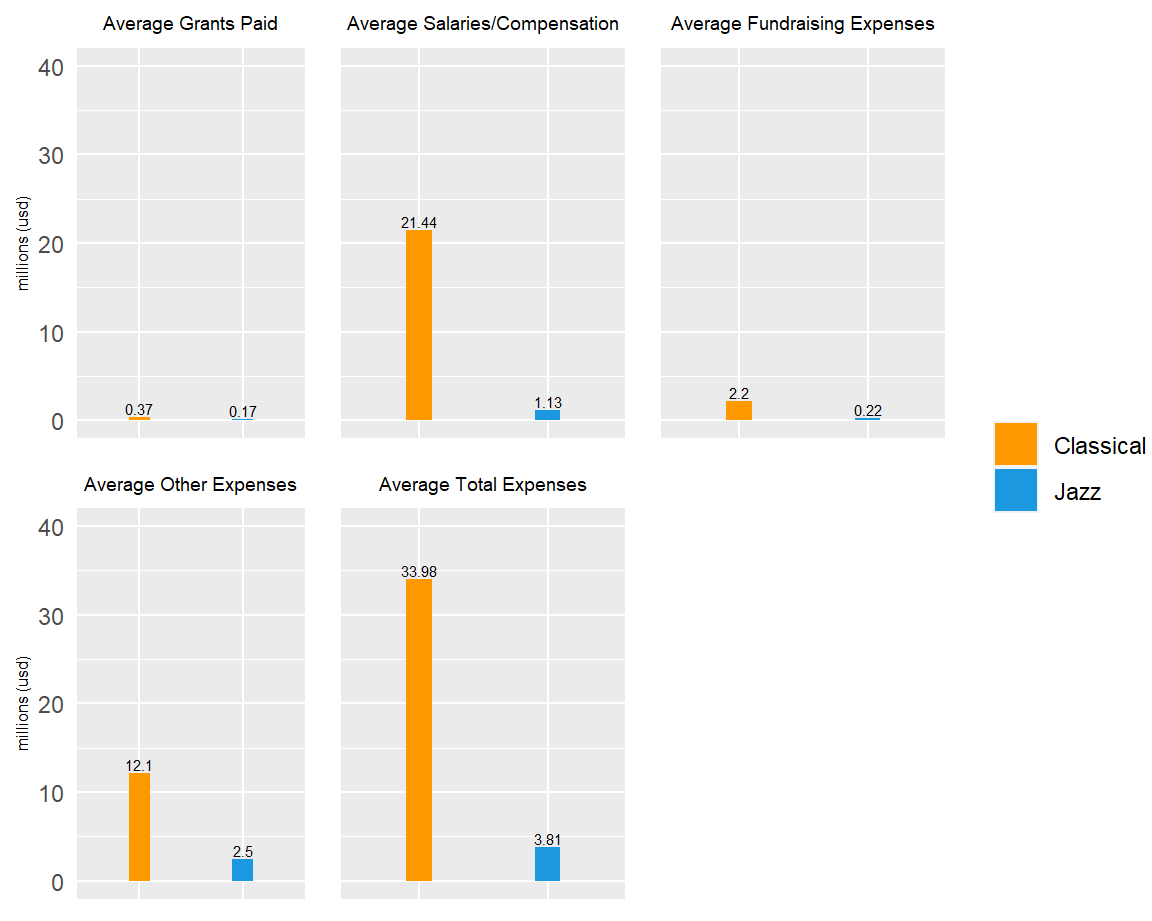
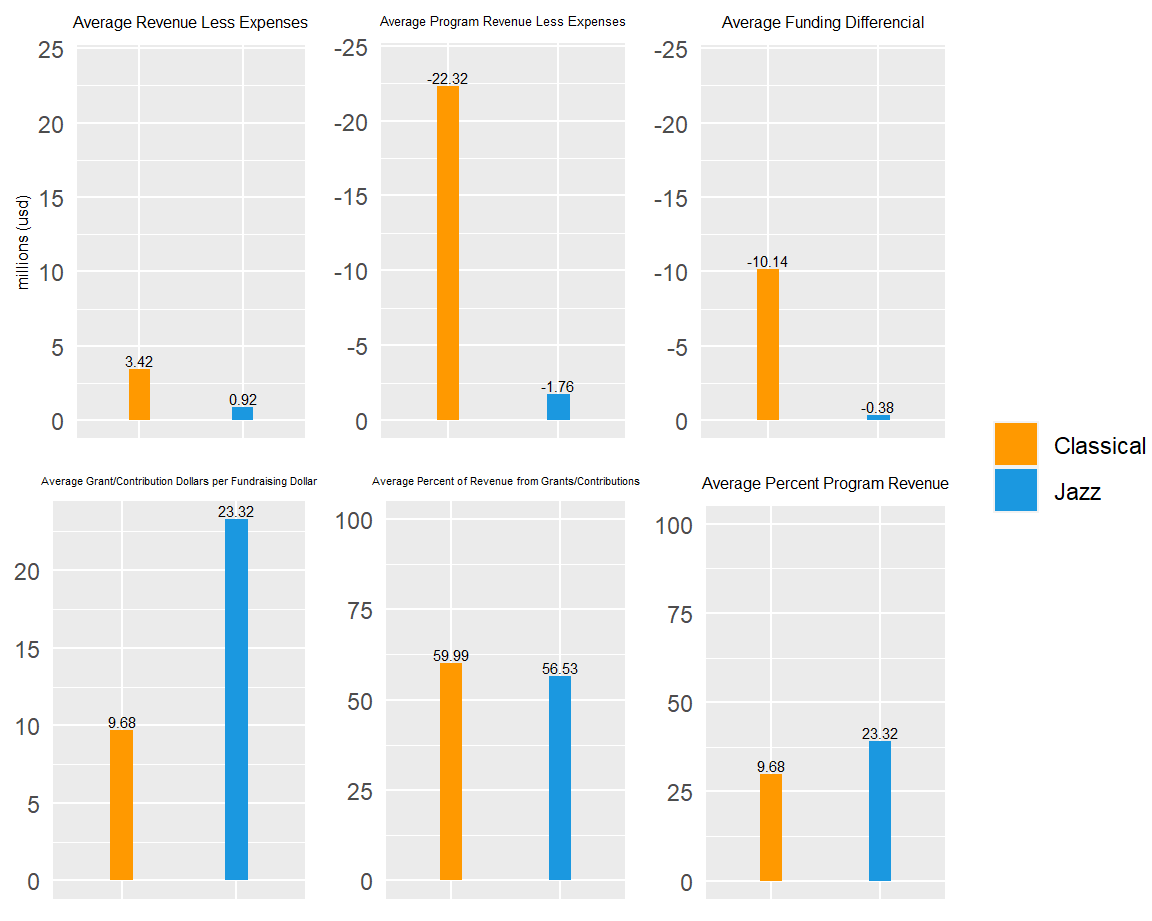
Bottom Line
Totals by Type
Column
Personnel
Revenue
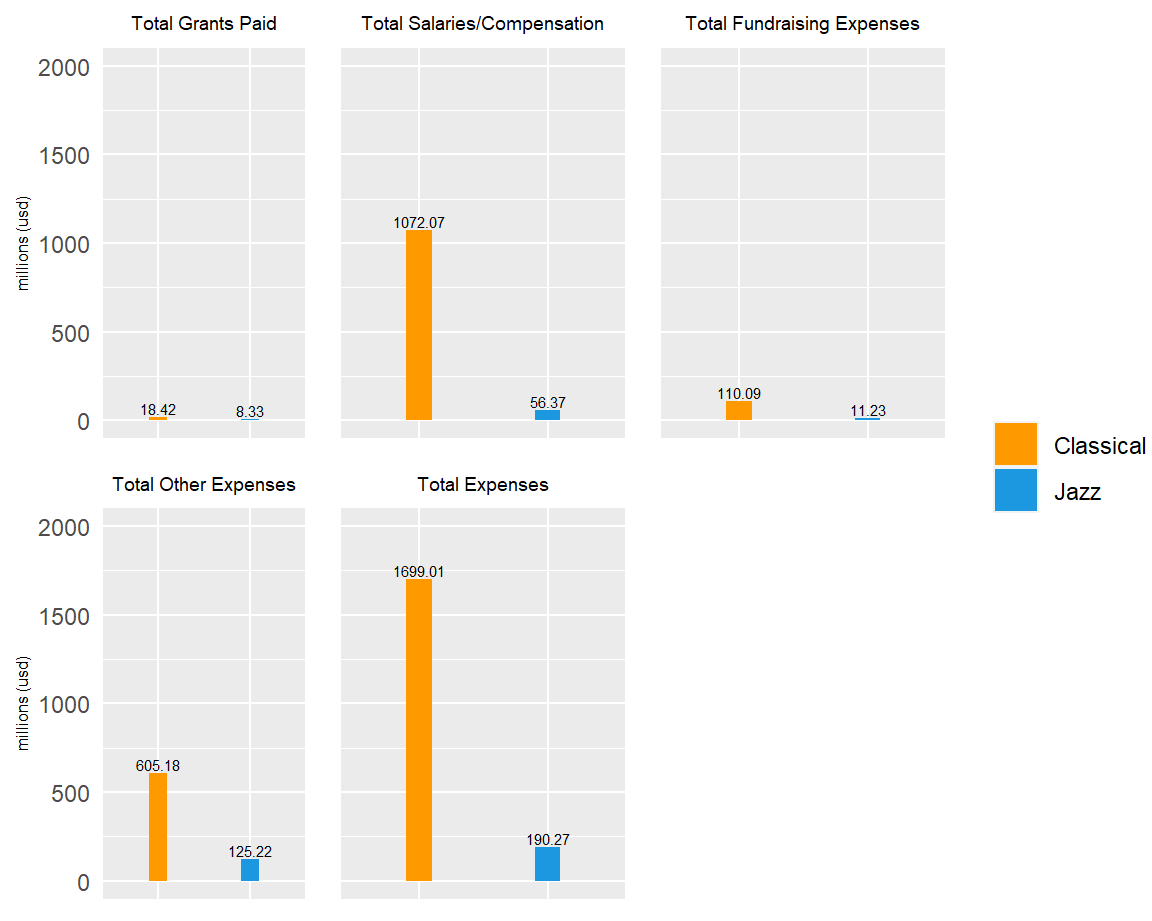
Expenses
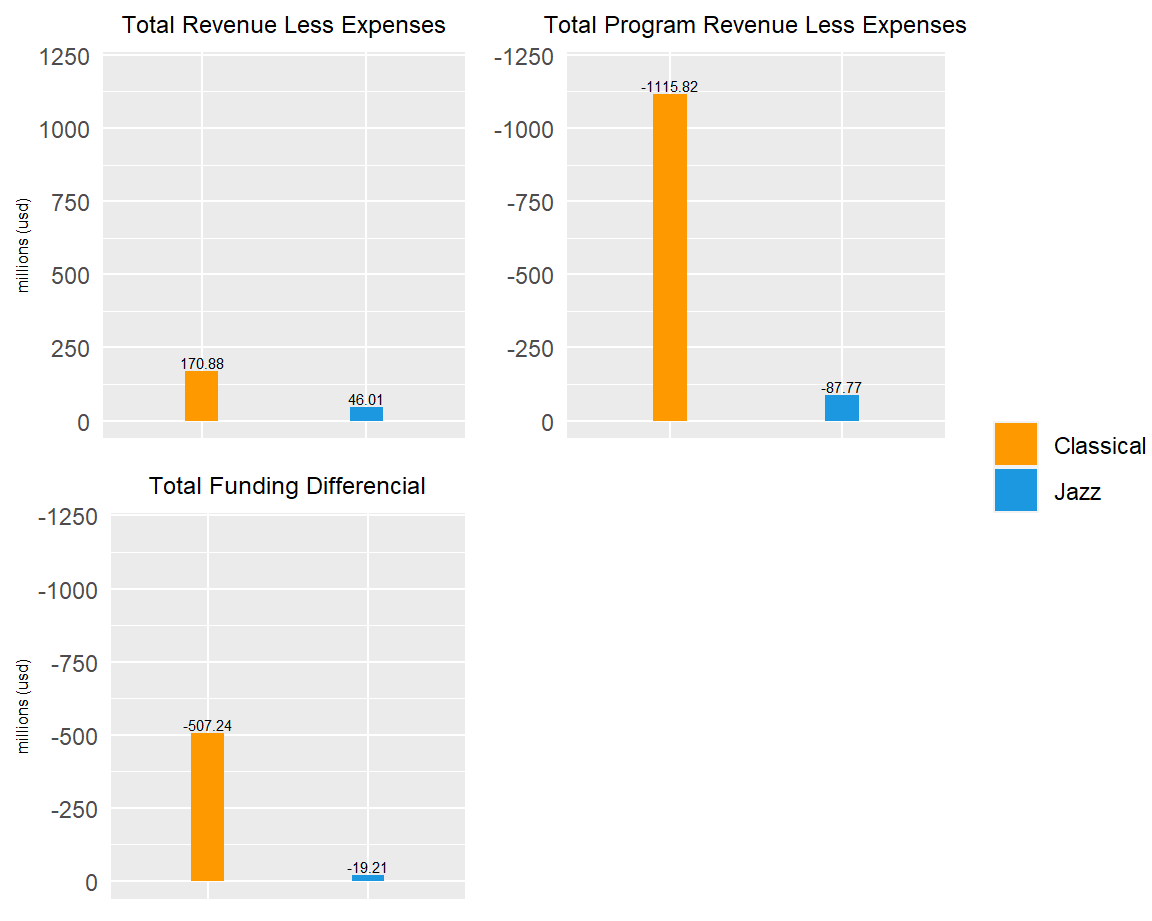
Bottom Line
Conclusion
Column
Discussion
The answer to the first question proposed by this study, “Is there a funding disparity between Jazz and Classical Institutions?”, is yes. There is unquestionably a funding disparity between the top 50 Jazz and Classical Institutions, which brings the next question, how is this disparity quantified.
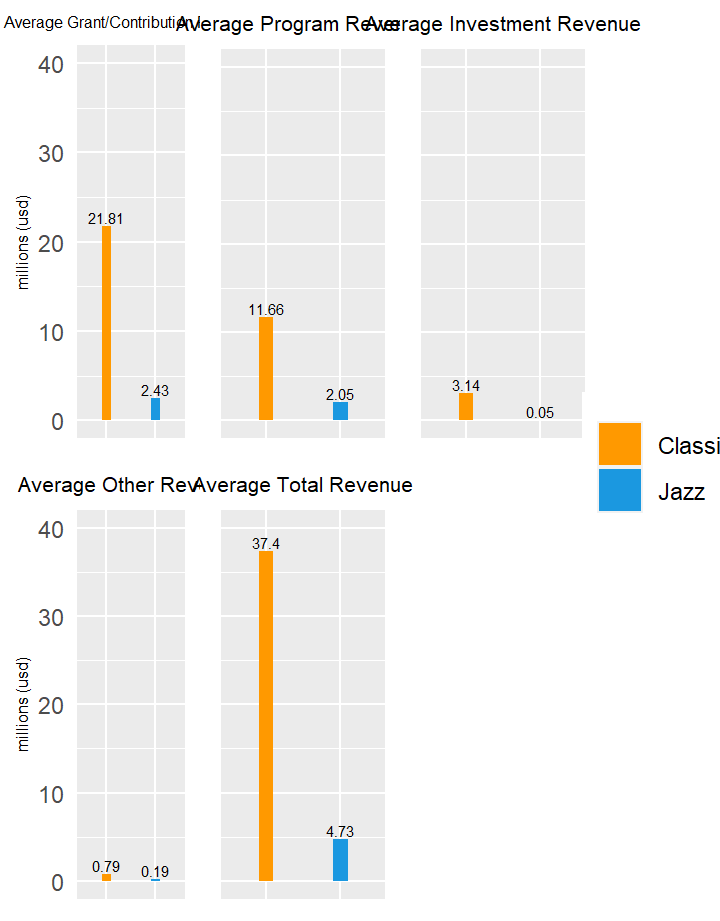
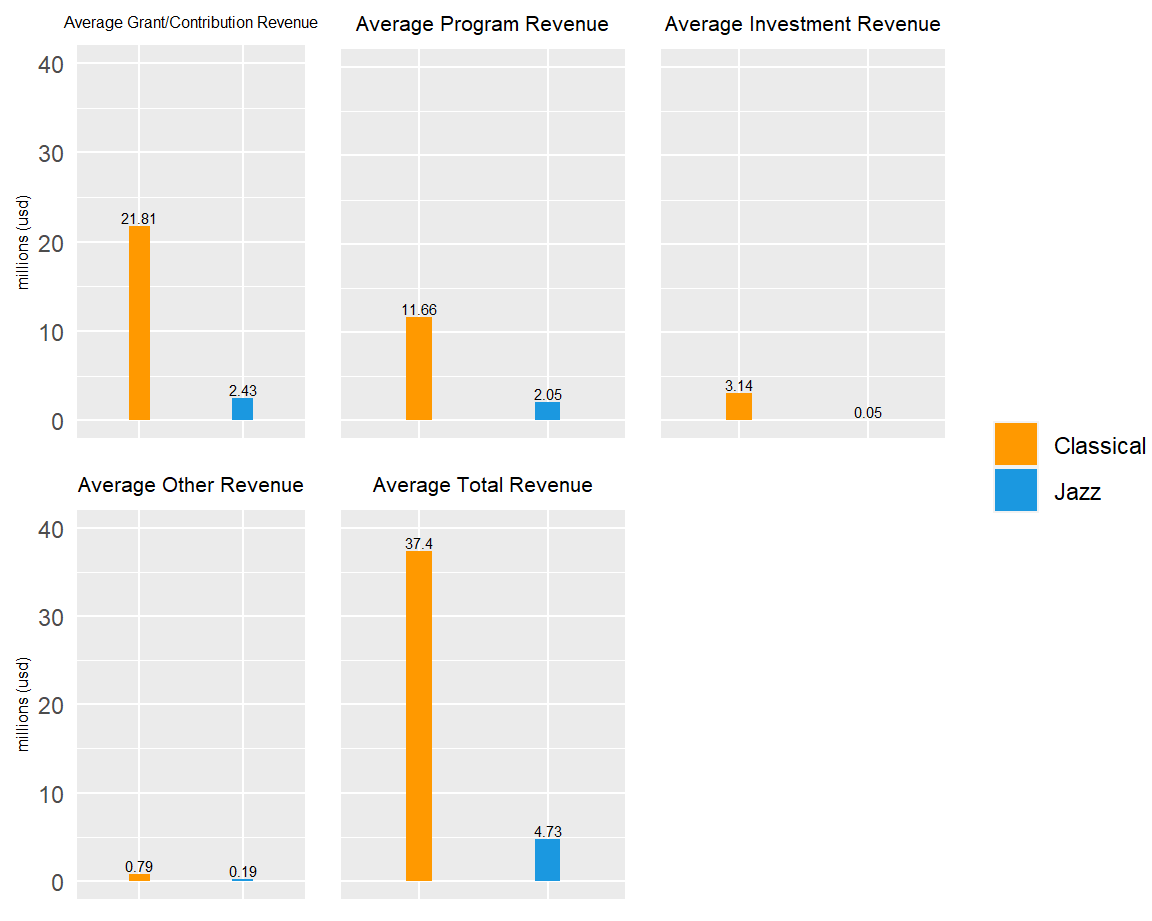
If we look at the averaged metrics, we find a great disparity in favor of the Classical World. Among the revenue metrics we see an average discrepancy of:
- 790.69% in Total Revenue,
- 897.53% in Grant/Contribution Revenue
- 6,280% in Invenstment Income
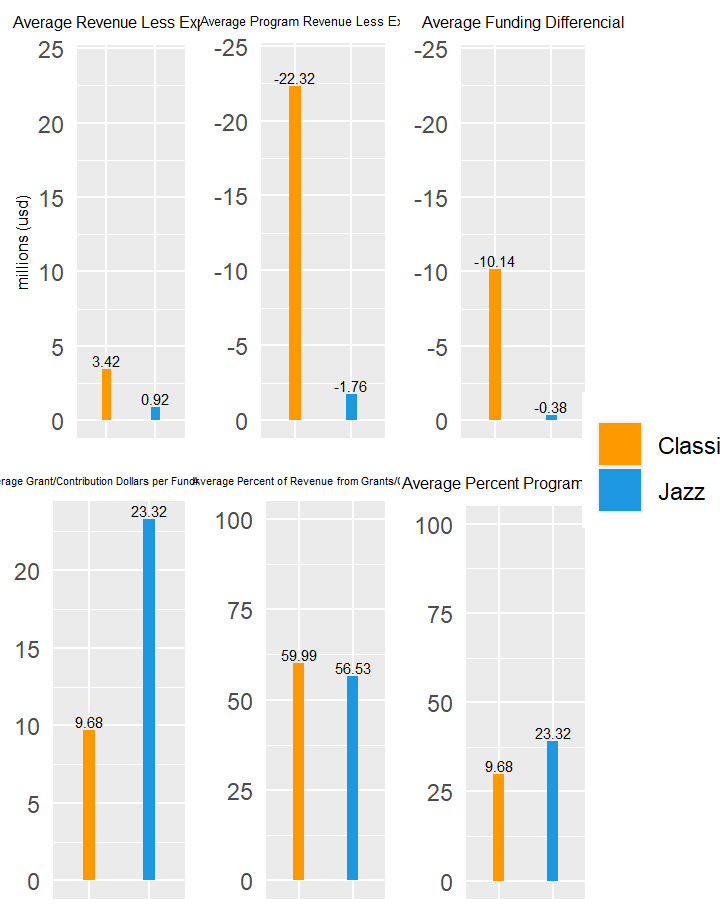
When we look at the last major revenue metric, Program Revenue, a similar disparity to Total Revenue or Grant Revenue. However the gap is considerably smaller at 568.78%, which aligns with the data from both the Percent of Revenue from Grants and Percent Program Revenue metrics respectively. This suggests that Jazz Orgaizations get a higher percentage of their revenue from sales and are closer to being able to support themselves without outside money.
Solvency, although not the main focus this study, is in fact a point of interest in future discussions about the sustainability of Art Musics in America. It is clear from this dataset that the majority of Jazz and Classical Institutions cannot support themselves without major philanthropic support, however, it is worth while to see which group is closer to being able operate on their own.
Another interesting metric is Grant Dollars per Fundraising Dollar. This can be seen as a return on investment for fundraising expenses. Here, Jazz Organizaions average $23.32 per fundraising dollar, whereas Classical Organizations average $9.68.
Column
Conclusion
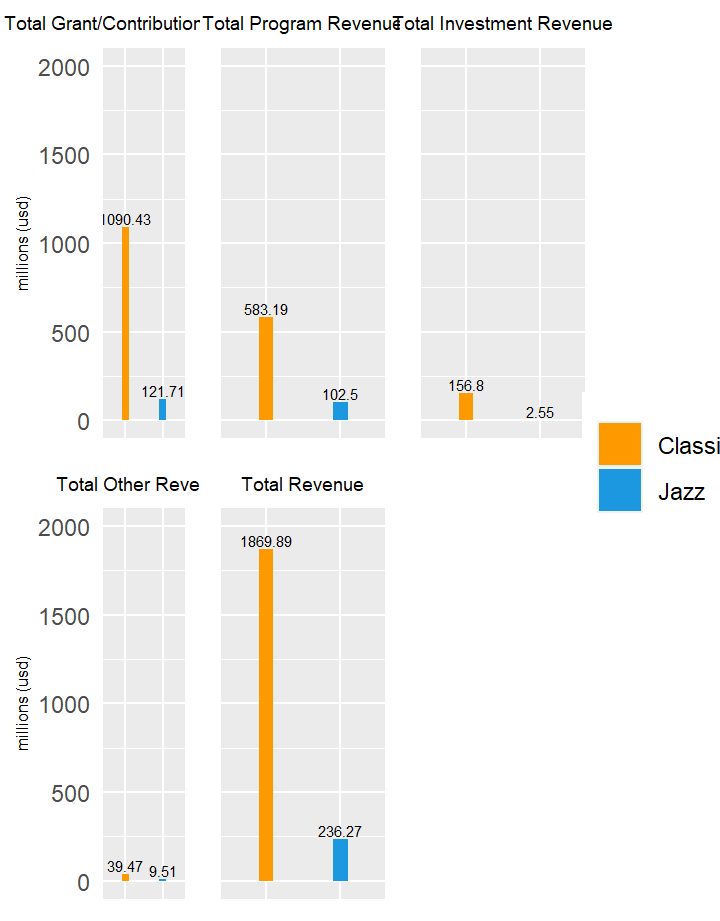
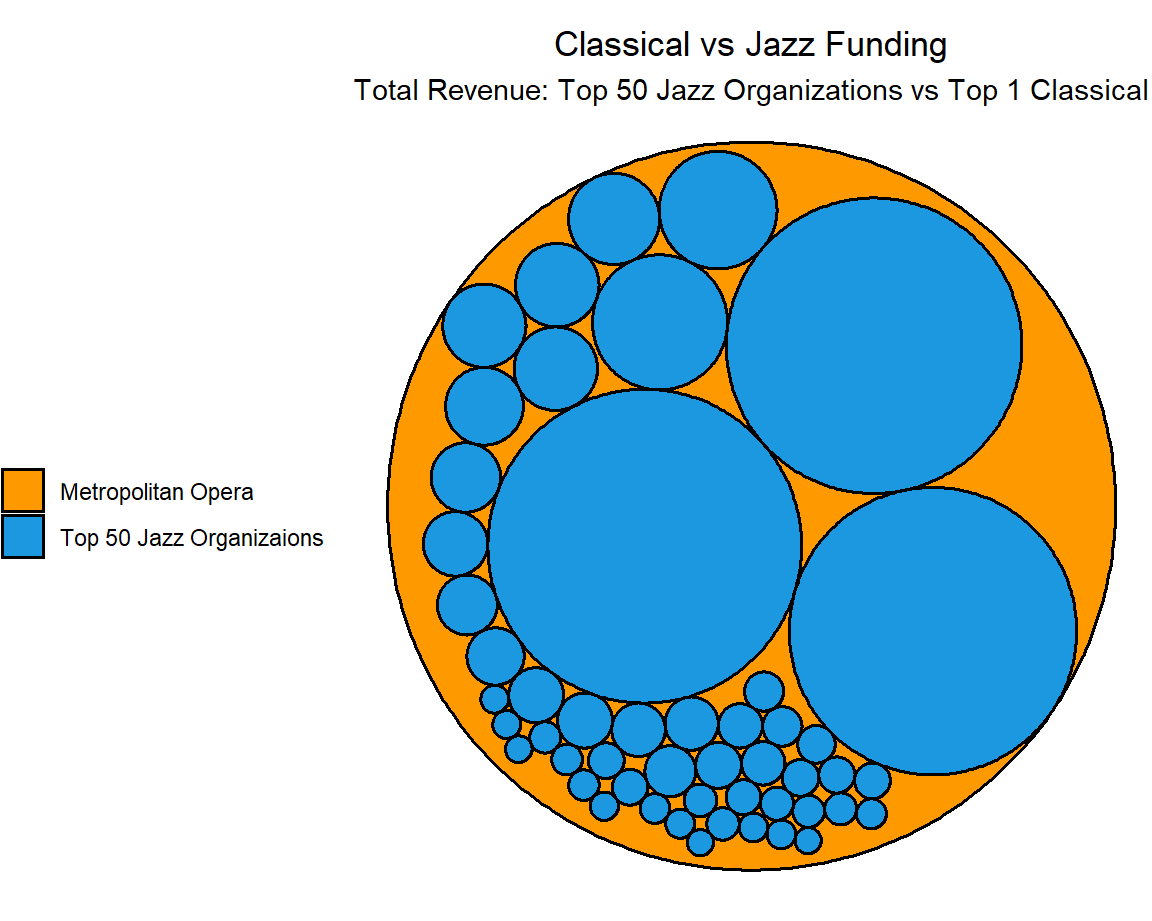
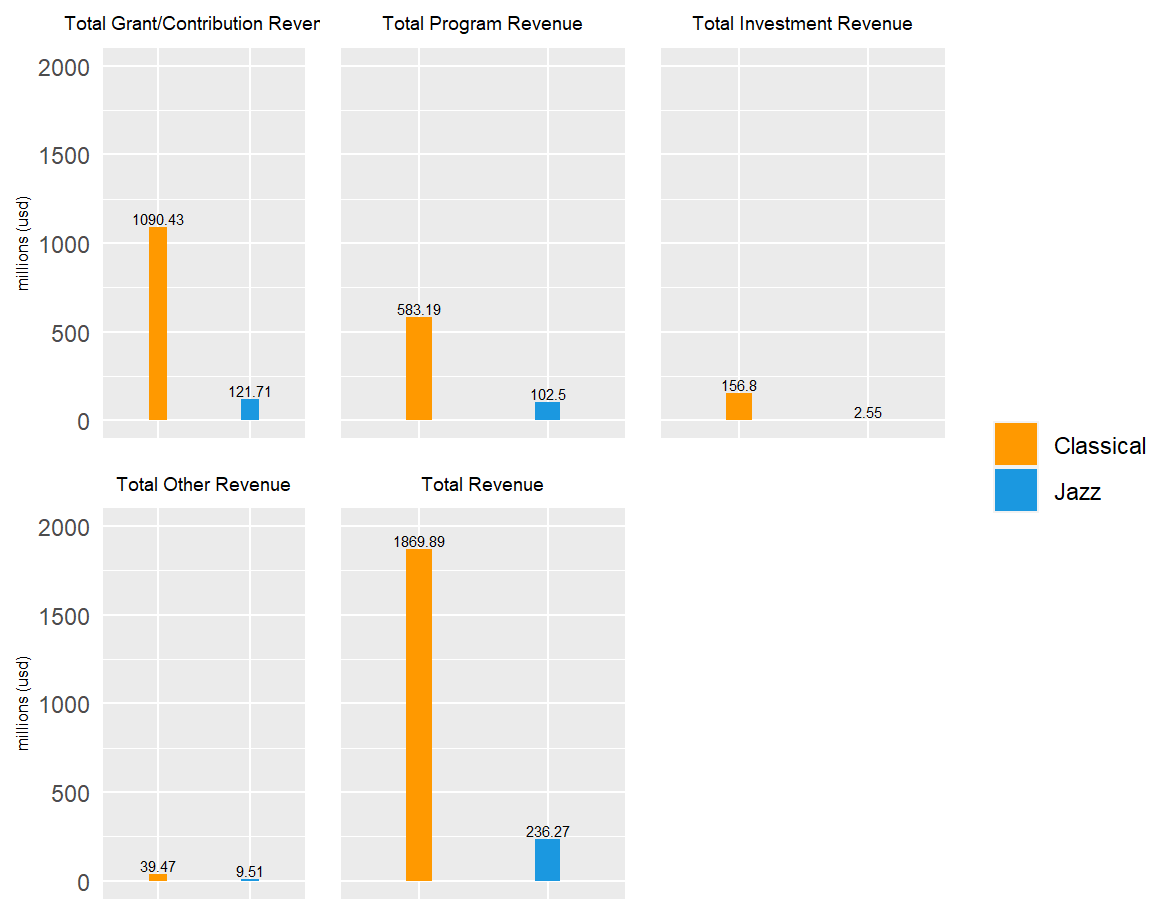
In conclusion, there is no doubt that Classical Organizations have more funding than their Jazz counterparts. In total the 50 largest Classical Institutions have at their disposal:
- $1.86 billion in Total Revenue
- $1.09 billion in Grants/Contributions
- $583 million in Program Revenue
- $156 million in Investment Revenue
compared to the 50 largest Jazz Organizations:
- $236 million in Total Revenue
- $121 million in Grants/Contributions
- $102 million in Program Revenue
- $2.5 million in Investment Revenue
These totals are orders of magnitude apart. However, Jazz Organizations seem to be less dependent on outside money, get higher returns on foundraising expenses, and on average seem to make more with less.
Column
Next Steps
Moving forward, let us consider:
Why does this funding deficit exist?
What can be done about it?
and…
What would the Jazz Ecosystem look like if Jazz Institutions were funded on the same level as their Classical peers?
Possible Future Studies
- How is the pandemic affecting the funding disparity?
- How is funding distributed in organizations that fund both Classical and Jazz Organizations?
- How is funding distributed in organizations that present both Classical and Jazz Music?
Data/Glossary
Column
Original Dataset
Averages by Type
Totals by Type
Column
Glossary
Averages by Type
This section expreses the data fields as averages per organziation in order to compare Jazz and Classical institutions.
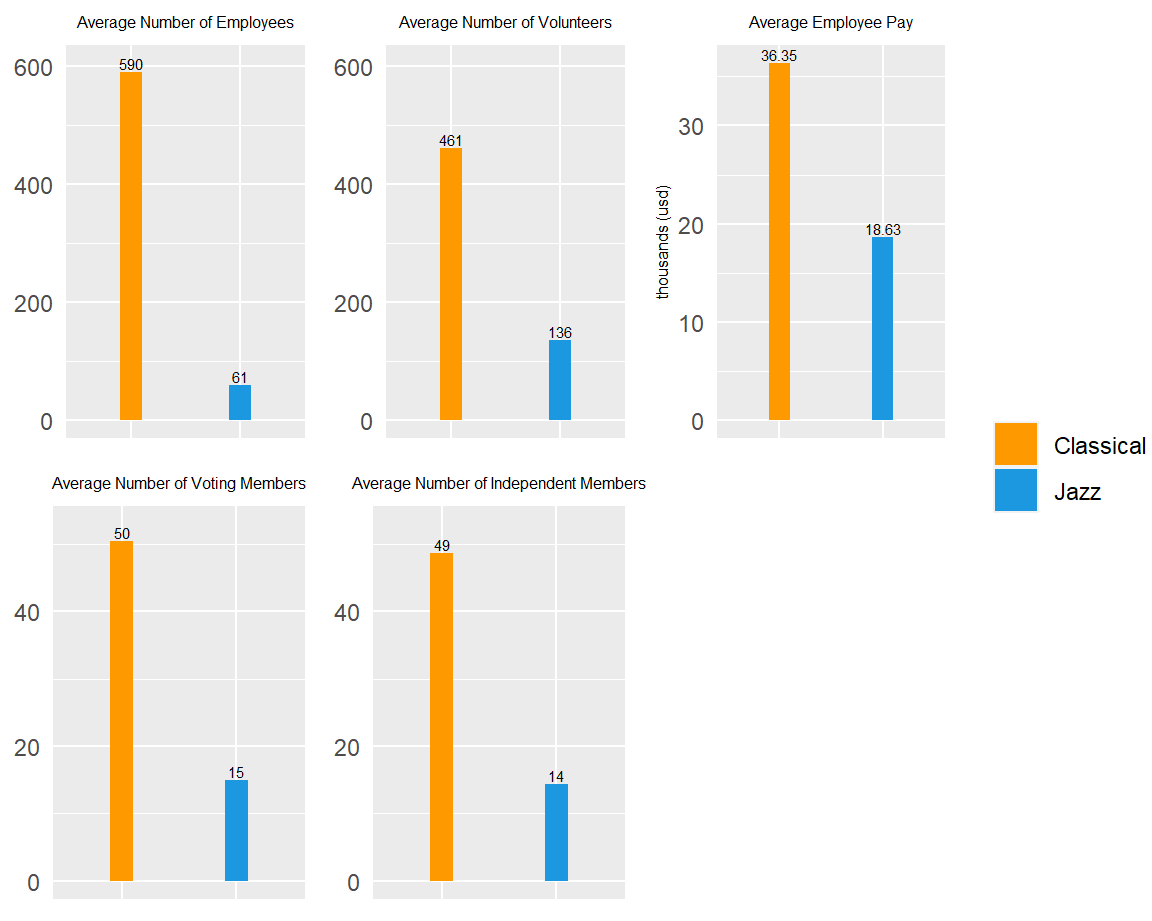
Personnel: Data concerning human resources
- Employees Number of employees
- Volunteers Number of volunteers
- Average Employee Pay Average yearly pay per employee
- Voting Members Number of voting board members
- Independent Members Number of independent board members
Revenue: Data concerning yearly income
- Grant and Contribution Revenue Income from grants/donations/contributions
- Program Revenue Income from sale of tickets, goods, or services
- Investment Reveune Income from investments, trust funds, etc.
- Other Revenue Income from other sources
- Total Revenue Total income
Expenses: Data concerning yearly operative costs
- Grants Paid Amount paid out in grants
- Salaries/Compensation Amount paid to exployees
- Fundraising Expenses Amount spent fundraising
- Other Expenses Amount spent on other factors
- Total Expenses Total cost of operation
Bottom Line: Data concerning yearly overall finances
- Revenue Less Expenses Total income minus total cost of operation
- Program Revenue Less Expenses Program revenue minus cost of operations
- Funding Differential Grant funding minus Program Revenue
- Grant/Contribution Dollar per Fundraising Dollar Return on investment of fundraising expenses
- Percent of Revenue from Grants/Contributions Proportion of Grant Funds to Total Revenue
- Percent Program Revenue Proportion of Program Revenue To total Revenue